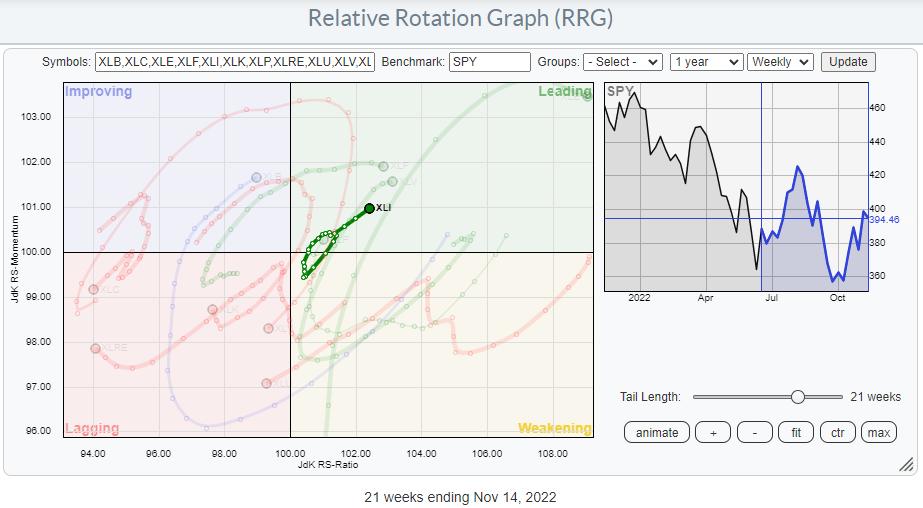
For weeks already, the rotation of the Industrial sector continues its way deeper into the leading quadrant at a strong RRG-Heading.
For my appearance on the panel of The Pitch for this month, I looked at the Relative Rotation Graph of US Sectors to identify three strong sectors where I wanted to search for my five stock picks. The industrial sector surfaced in that exercise. Together with Materials and Consumer Staples.
While going through that process, I came across many more interesting charts than the two I pitched in the show.
The industrials sector makes up 8.5% of the S&P 500 index but holds 71 stocks. This is one of the larger sectors regarding the number of constituents.
So for this article, I am going to bring in one additional layer to get a better handle on the distribution within the sector.
The RRG above holds the industry groups inside the Industrials sector against XLI as the benchmark. This image very well shows the diversity of industries within the sector. Some are showing very nice and strong rotations, but there are also a few that are the complete opposite.
The Bad
The groups on this RRG are all on a negative rotation against the sector index, which is doing well against the S&P 500. This means that it is very well possible to find reasonable or good charts in these groups, but it is very likely to find better opportunities in the groups that are at a positive rotation against XLI as they are automatically outperforming the S&P 500 as well.
The Good
To get a clearer picture, I removed all the tails that are not moving in a favorable direction. I decided to leave $DJUSHV (Heavy Construction) on the RRG as it currently has the highest RS-Ratio reading and enough leeway to complete its rotation through weakening and then rotates back to leading.
The rotations that I am most interested in are $DJUSID and $DJUSAS. The reason is that they are at a strong RRG-Heading and close to crossing over into the leading quadrant, which means they are then qualified as being in a relative uptrend (against XLI).
$DJUSHV probably needs a bit more of a rotation through the weakening quadrant before this group can rotate back up. In other words, there is still time to pick this one up when it actually rotates back up. $DJUSHR is at the highest RS-Momentum level, making it vulnerable to setbacks when that momentum starts to dip. And $DJUSAR is still low on the RS-Momentum axis compared to the other groups. If there were no alternatives, I would consider this one, but for the time being, that is not necessary.
Diversified Industrials
This RRG shows the rotation for the stocks in that group against XLI. Even though the group is doing well against XLI, you can see that there are quite some opposing rotations. Two of the bigger names in this group that are showing strong rotations, and therefore the drivers of strength, are GE and HON.
Both stocks just ended a downtrend in price with the completion of a double-bottom formation. Shortly after the break, these formations usually provide investors with a good risk-reward ratio as the protection, in the form of a stop-loss or support level, is nearby while there is significant upside potential.
In case you are looking for a real bargain and not shy of some additional risk, you may want to check out the chart for SWK.
This stock came all the way down from a high above 220 in May 2021 to a low at 70.24 in the week of October 10. A decline of around 70%! The RRG-Lines are slowly picking up some relative improvement.
And in case you were ever wondering whether markets have a “memory?” Recently SWK bottomed at $ 70.24. The low back in March 2020 was at $70.00… That is good enough for me.
One thing is for sure. You won’t be buying at the top 😉
Aerospace
The Aerospace group is a bit smaller in terms of constituents. Two of the tails are currently at positive RRG-Heading, RTX and BA.
Of these two, BA has the best potential, IMHO. The improvement in relative strength is the strongest of the two, while there is still plenty of room for BA to move deeper into the leading quadrant.
The stock is about to complete a large double-bottom formation on the price chart. We are not there yet, so it is an early call. But as if and when that peak around 172 can convincingly be broken upwardly, a rally towards the next area of resistance around 220 looks possible.
#StaySafe and have a great weekend, –Julius


