OK, so we know the market is going down. And, save for a mid-summer bear market rally, the S&P 500 and Nasdaq have been in fairly consistent downtrends.
Last week, I highlighted the extreme bearish readings in the AAII Survey (it’s worth noting that this week NAAIM Exposure Index also reached its lowest level since March 2020) and we’ve also covered the weakening breadth conditions. Today, I wanted to share the most recent check on the “confirmed bearish market” checklist. The New Dow Theory registered its first sell signal since June, confirming a broad market decline.
So what is the new Dow Theory?
It starts with Charles H. Dow, who truly laid the foundations for modern technical analysis. He pioneered the concept of market indexes and created tools and measures that have evolved into the practice of trend-following.
ChartCon 2022 is happening in just a week! This week, I chatted with Tom Bowley, Mary Ellen McGonagle and Leslie Jouflas about our Interactive Market Outlook Panel. We’ll be discussing the results of THIS SURVEY, so take a minute to add your voice to the discussion!
We have so many ideas and perspectives to share with you, and you don’t want to miss this rare opportunity to learn from some of the top names in technical analysis! Sign up for ChartCon today.
One of his core concepts was to measure the strength of the market by considering two groups of stocks: the Industrials (the producers of goods) and the Railroads (the distributors of goods). The idea was that if these two main parts of the economy were in good shape, then the market was strong, but if one side was trending higher while the other index did not confirm that trend, then something was broken.
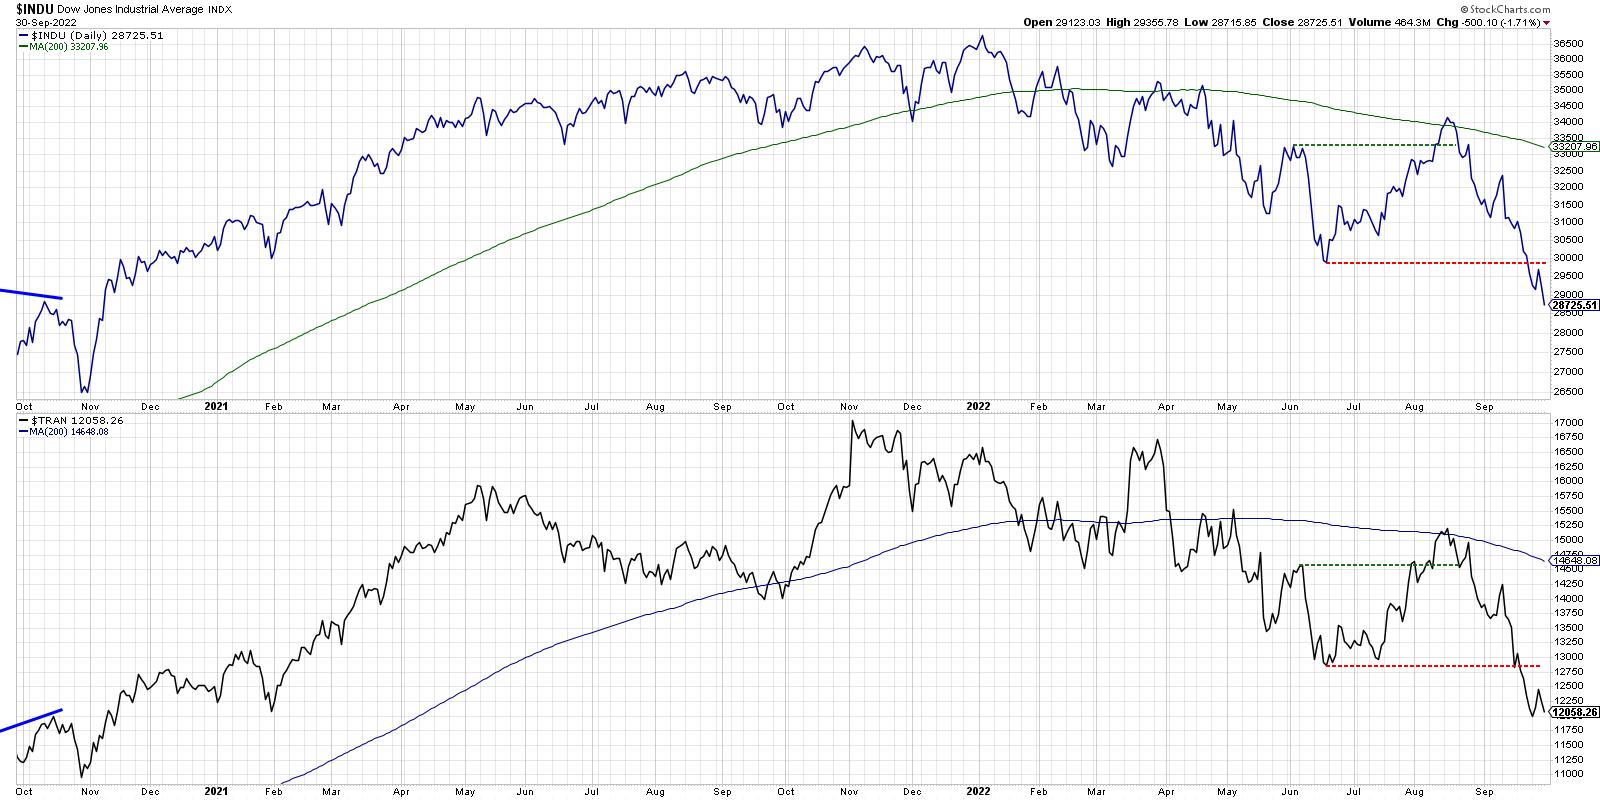
The Railroad Index eventually became the Transportation Index, and that leads us to the chart of what we call Traditional Dow Theory.
In last weekend’s report to my premium subscribers, we talked about the Dow Theory sell signal, which was confirmed when both the Dow Industrials and Dow Transports made a new swing low. But while those indexes both made new lows last week (along with many individual stocks, I might add), the S&P 500 and Nasdaq Composite had not done so. This brings up to the New Dow Theory, which I would suggest is a modernized version of what Charles Dow was really trying to capture.
Here we are reviewing the patterns for the “old economy” stocks (S&P 500) vs. the “new economy” stocks (Nasdaq Composite). If both of these confirm new highs, as they did in April 2021, then the market uptrend is confirmed. If one makes a new high but the other does not (see January 2022!) then it is considered a non-confirmation and a potential reversal.
What can this chart tell us of the current market environment? Well, as of this Friday’s close, both the S&P 500 and the Nasdaq have made a new swing low, as they both undercut their low from June 2022. That means we now have a New Dow Theory sell signal.
But didn’t we know the market was already going down? Absolutely. And that means you will most likely have continued sell signals, as we did in January and May and June. Every time these indexes both make a new low, it confirms the direction of the overall market trend.
What would a market bottom likely look like, using this chart? Ideally, there would be a bearish non-confirmation at the bottom, meaning one of the indexes makes a new low while the other makes a higher low. It does not always happen, to be certain, but when it does occur, it tends to be a great signal of a potential inflection point.
The most basic way to use this indicator is to look for them both to make a new swing high. Which they did back in August, just before both indexes found resistance at the 200-day moving average. We highlighted this signal back in August, leading us to very much consider the prospects of higher prices ahead.
In the end, the market trend was once again defined this week, as a new sell signal indicated that, for the foreseeable future, the trend is down. Which means that, until we get a valid buy signal, the path of least resistance remains down.
RR#6,
Dave
P.S. Ready to upgrade your investment process? Check out my YouTube channel!
David Keller, CMT
Chief Market Strategist
StockCharts.com
Disclaimer: This blog is for educational purposes only and should not be construed as financial advice. The ideas and strategies should never be used without first assessing your own personal and financial situation, or without consulting a financial professional.
The author does not have a position in mentioned securities at the time of publication. Any opinions expressed herein are solely those of the author, and do not in any way represent the views or opinions of any other person or entity.


